Note: This chart initially uses the S&P 500 as its "baseline." Click on the S&P 500 button to view absolute performance numbers.
Note: This chart initially uses the S&P/TSX Composite as its "baseline." Click on the S&P/TSX Composite button to view absolute performance numbers.
Intermarket Technical Analysis is the study of the relationships between the four major financial markets: Stocks, Bonds, Commodities and Currencies. There are several key relationships that bind these four markets together. These relationships are:
- The INVERSE relationship between commodities and bonds
- The INVERSE relationship between bonds and stocks
- The POSITIVE relationship between stocks and commodities
- The INVERSE relationship between the US Dollar and commodities
POSITIVE: When one goes up, the other goes up also.
INVERSE: When one goes up, the other goes down.
When these relationships occur, the markets are said to be acting "normally" and there is a good probability the current trends will continue. When one or more of these relationships break down, the markets should be watched carefully for signs of general trend reversals.
[For more detailed info, see our article on Intermarket Technical Analysis.]
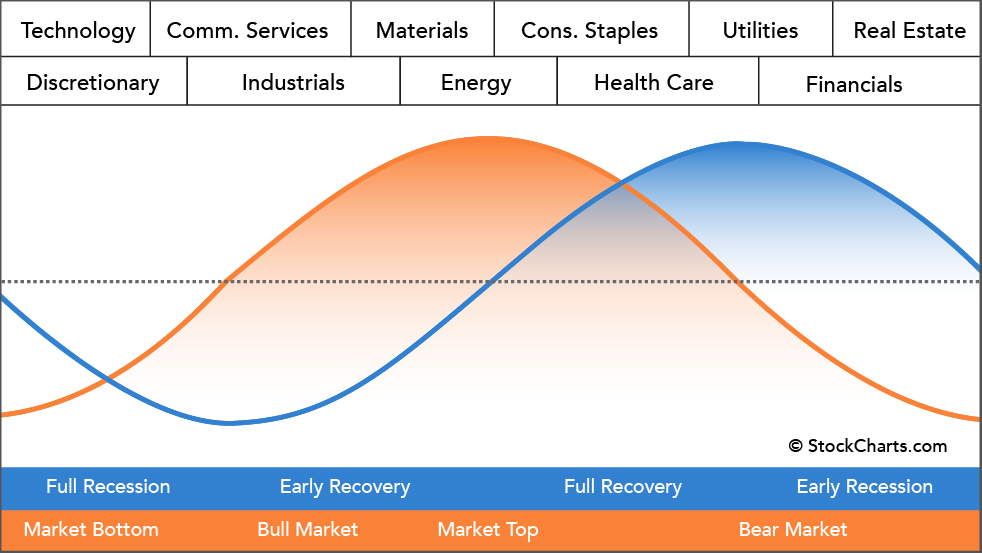
Legend: Market Cycle | Economic Cycle
This theoretical model is based on Sam Stovall's S&P's Guide to Sector Rotation and states that different sectors are stronger at different points in the economic cycle. The graph above shows these relationships and the order in which the various sectors should get a boost from the economy. The Market Cycle preceeds the Economic Cycle because investors try to anticipate economic effects. The PerfChart at the top of this page tries to help you see this effect.
| Stage | Full Recession | Early Recovery | Full Recovery | Early Recession |
|---|---|---|---|---|
| Consumer Expectations | Reviving | Rising | Declining | Falling Sharply |
| Industrial Production | Bottoming Out | Rising | Flat | Falling |
| Interest Rates | Falling | Bottoming Out | Rising Rapidly (Fed) | Peaking |
| Yield Curve | Normal | Normal (Steep) | Flattening Out | Flat/Inverted |